Português do Brasil
Security Maps of Rio de Janeiro
Map of average security sensation:
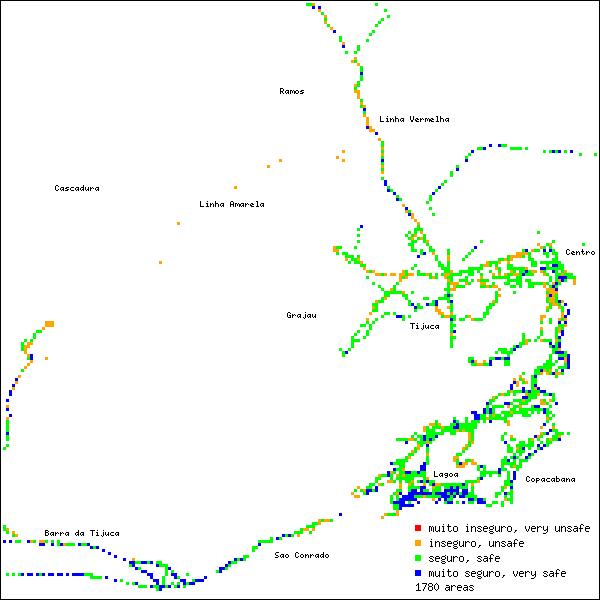
Security Map of Rio de Janeiro already presents good representation of security sensation feeling by people in the city. Number of evaluations of security sensations increases. We can see image of Rio de Janeiro downtown and South Zone. Lagoon Rodrigo de Freitas perimeter and Copacabana Beach are well defined.
You can consult detailed security evaluation of every place with app SegSense (only Android devices), using “see other area” functionality.
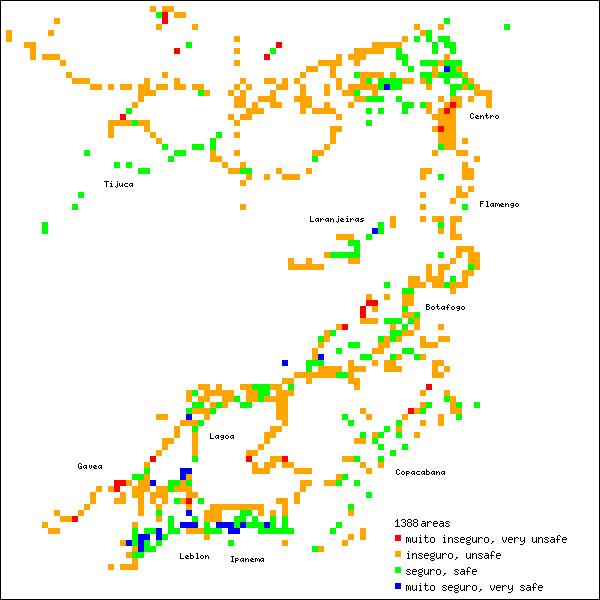
Map of average security sensation at open spaces (average for all hours of the day): Typically, this map represents sensation of pedestrians. Results show worst sensation that the average presented at picture above. Pedestrians don´t feel safe in Rio.
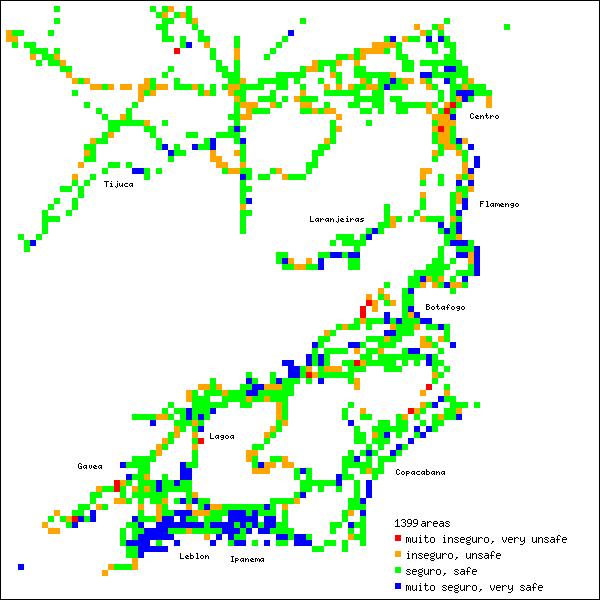
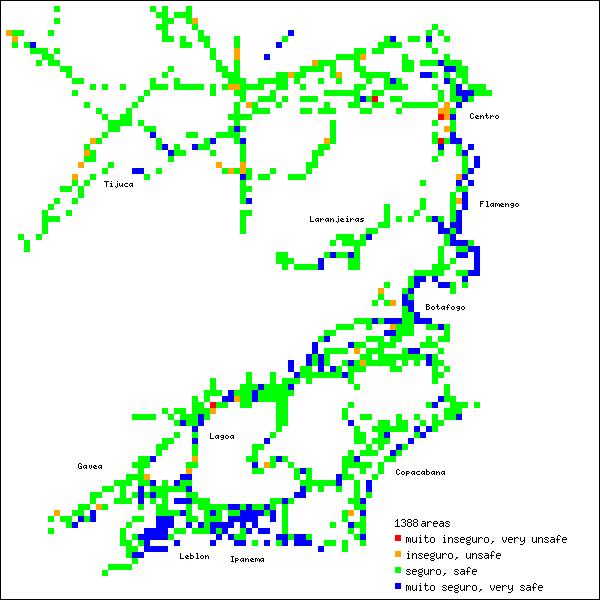
Map of security evaluations for people inside vehicles (average for all hours of the day): This map shows that drivers and passengers feeling more safe that pedestrians in Rio.
And a comprehensive view of Rio de Janeiro, including Barra da Tijuca and city exit, at north, by the Red Line (“Linha Vermelha”).